
Databox Reviews & Product Details
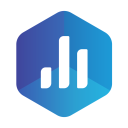
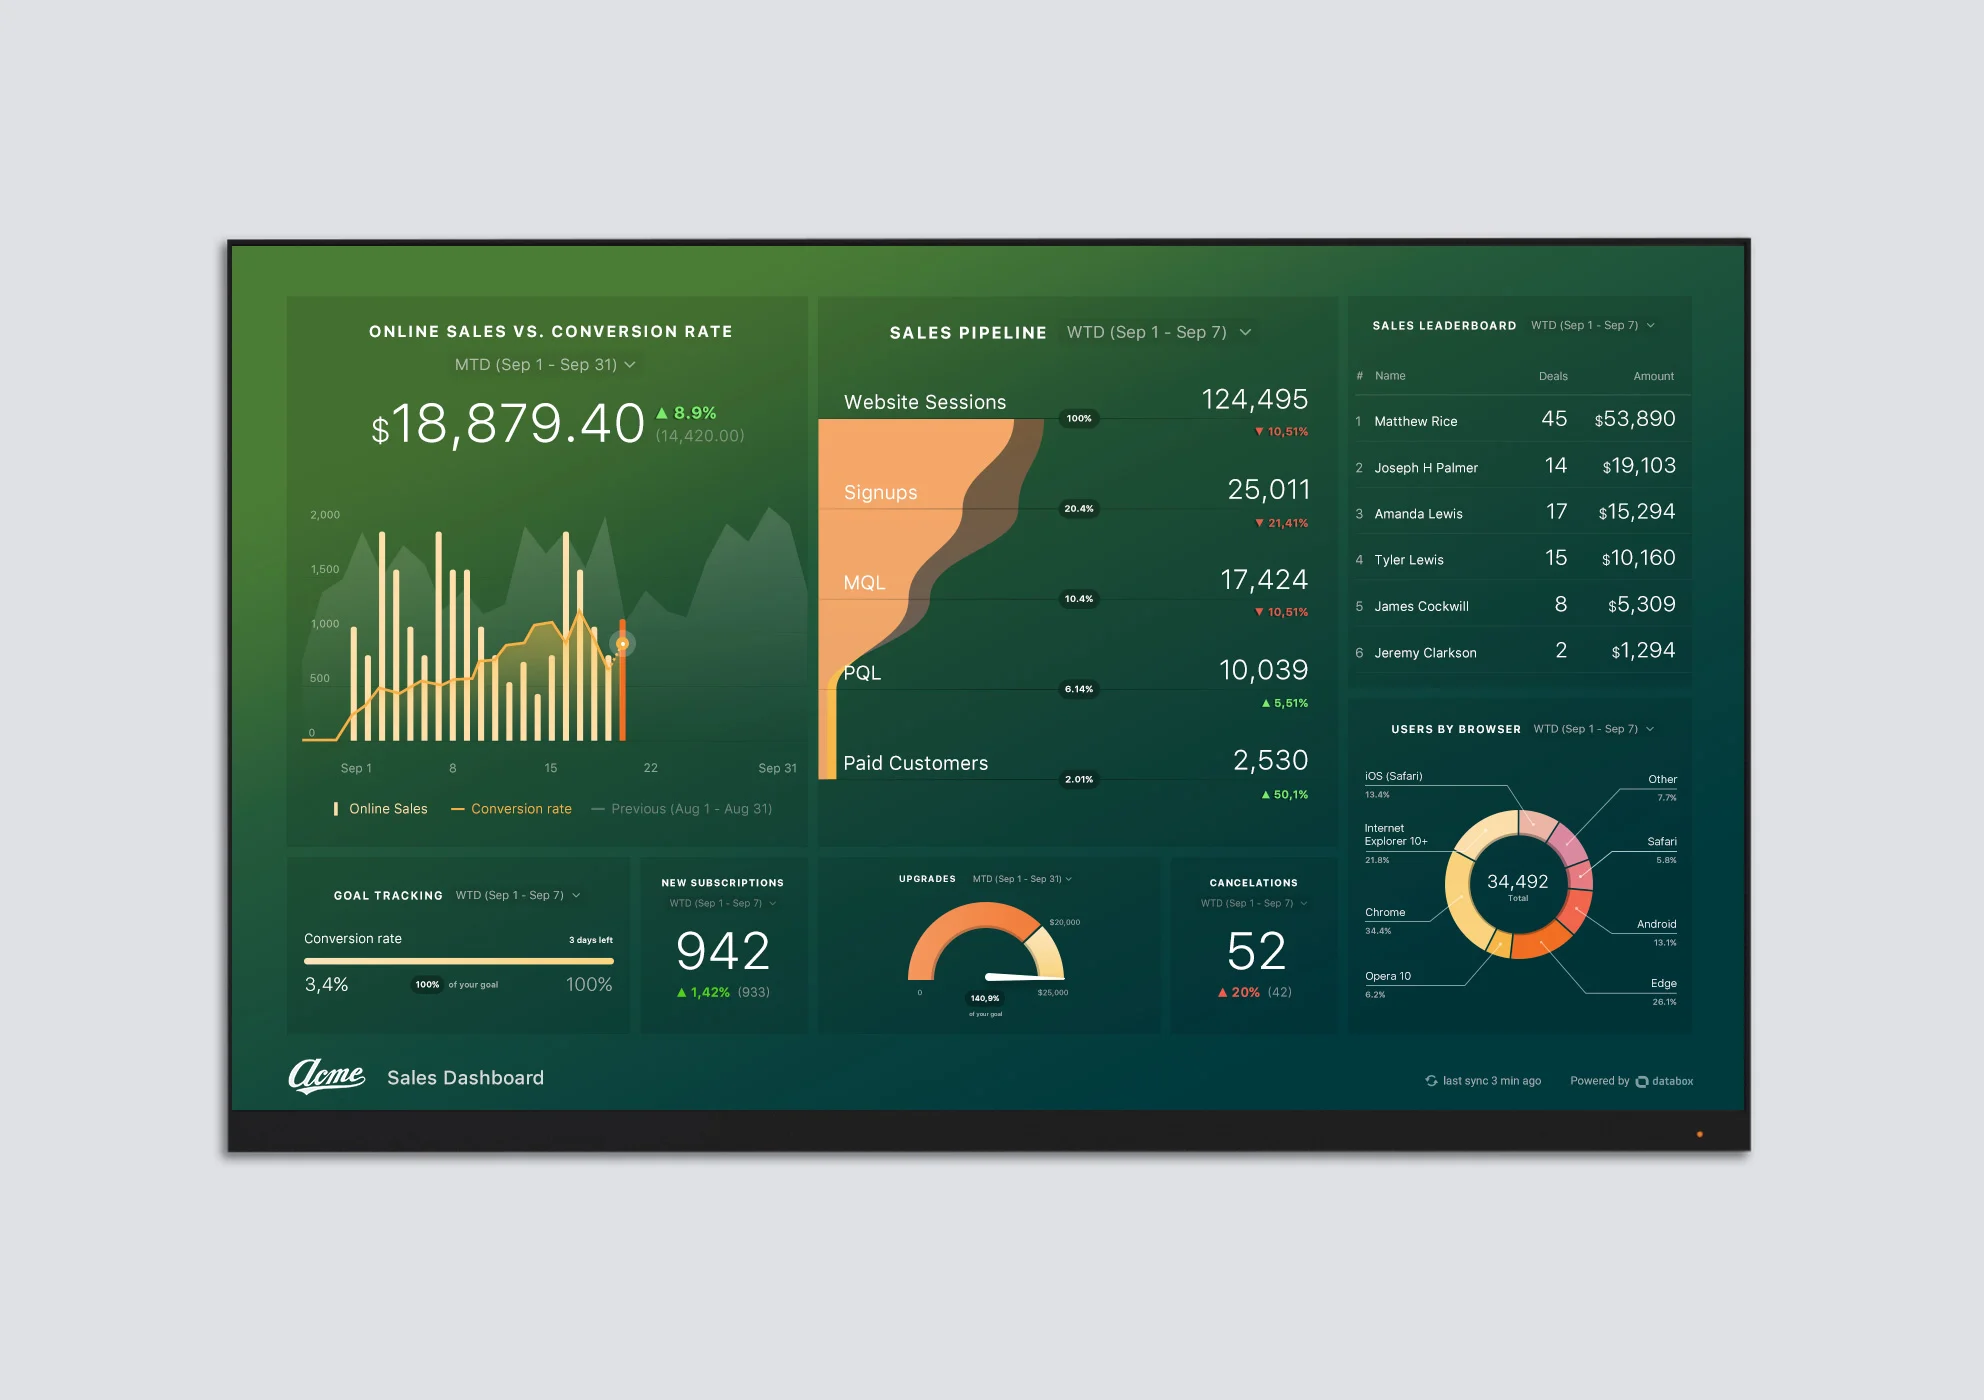
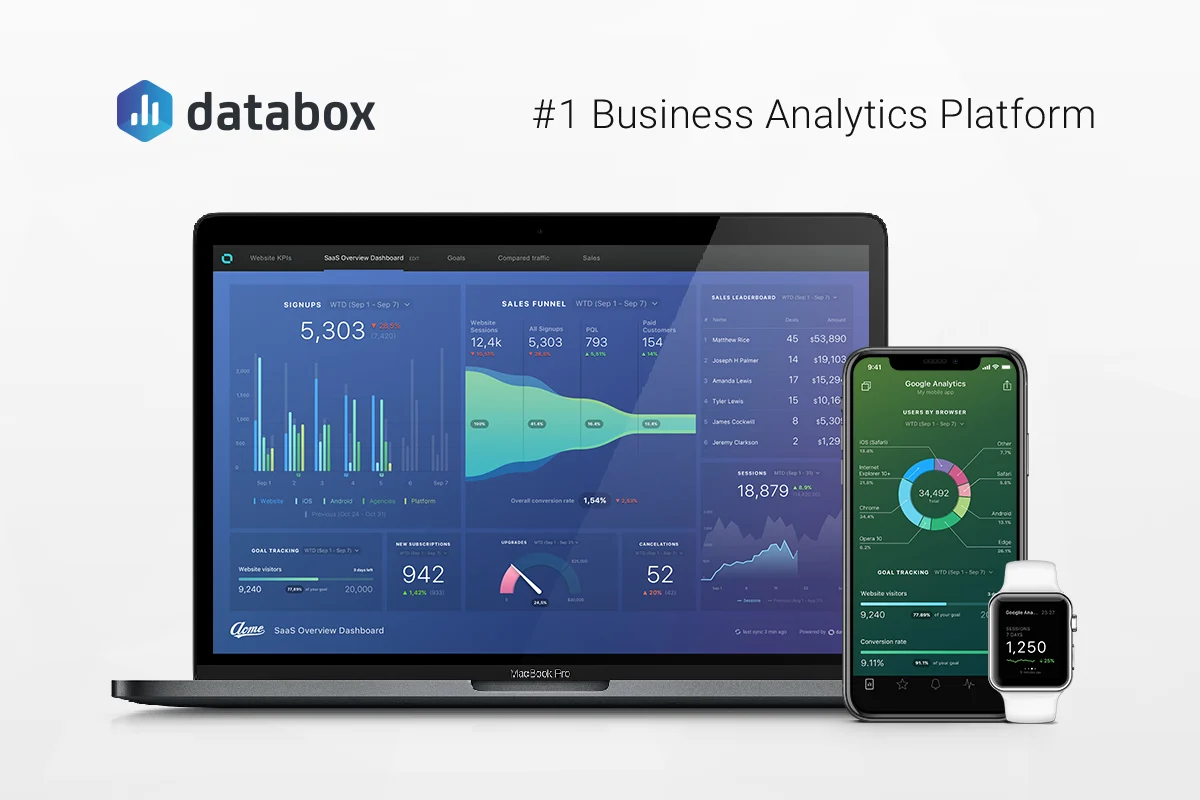
Databox is a cloud-based business analytics tool that lets users create custom analytics dashboards incorporating data from multiple sources, viewable from any device. The platform is specifically designed for high-level executives, analysts, and marketers, and makes navigation easy through single-click integrations, the advanced settings for unique metrics, and time intervals that can be modified and tailored to your needs.

| Capabilities |
|
|---|---|
| Segment |
|
| Deployment | Cloud / SaaS / Web-Based, Mobile Android, Mobile iPad, Mobile iPhone |
| Support | 24/7 (Live rep), Chat, Email/Help Desk, FAQs/Forum, Knowledge Base, Phone Support |
| Training | Documentation |
| Languages | English |


I love Databox. The UI interface is amazing, and I love the gradient used throughout the website. Databox has smooth controls and allows me to view all analytics related to my work.
Nothing that I found that I dislike in databox.
Databox helps us to track the performance of our company, teams and individuals anytime and anywhere.
I like best that Databox provides all of your sales metrics in one place combined with multiple data sources. So you can have all your business to business sales combined. It’s very easy user friendly. It really tracks the performance of your company.
The only dislike is that some key features are missing. It’s hard to discern between traffic sources and points in time as well as different dates because of it being too white of a interface. I would definitely add some color to make it easier to read data.
We have solved making client reports quicker and more interactive with the use of Databox. It really helps to also notice sale trends. Very clean.
Easy to use no big issues at this time- still learning product
Change in currency based on country you reside in
Easy to use: no big issues
The UI interface is really great and the smooth controls are top notch!
I have noticed that occasionally the data appears to show a little odd when using an iPhone app.
It's a great way to connect and centralize all of the data sources I have into one space.
Databox is perfect for creating data visualizations. It also has customizable dashboard.
The software is not entirely free. You have to pay extra bucks to fully take advantage of the tools.
I use databox for doing analytics and generating decent visualizations of my data.
all data is connected in one place, visualized dashboards, monitor progress toward goals, helps to track the performance of paid campaigns helps measure and evaluate marketing activities easy to share marketing performance with executive management
complicate to create new dashboards without using templates, and to create one dashboards with 3 different sources
Helps measure marketing activities. keep team focus on target helps optimize paid campaign and other marketing activities to achieve goals on time share dashboards to give better insights to team members and management.
I love that it gives you real time results on one screen. This makes it so easy to check from a marketing agency perspective.
It's really confusing for clients. They usually hate it, never use it, or ask tons of questions. Once they figure it out, they really dislike that they can't personally change the date ranges.
It honestly makes gathering data for reporting a lot easier! Even with the downsides, it still saves me so much time when putting quarter reports together.
Databox connects to all the services that I use. The connections are very easy to setup and all the "Deal info" comes over from Hubspot very easily.
I would have liked the Hubspot Contact info to come over also, but the contact info is restricted to whatever "smart lists" you define which is a workable solution.
A single place to see the key activity markers in my business.
It's easy to use and intuitive, it took me about 3 hours from sign up to set my PipeDrive DataBoard.
I think if it had a live chat for support it would be much faster to do the onboarding.
Data Analytics updated everyday from our sales team.
easy to install, connect to other softwares, cool graphics and dashboards
no option to set default currency throughout all databoards
monthly reports
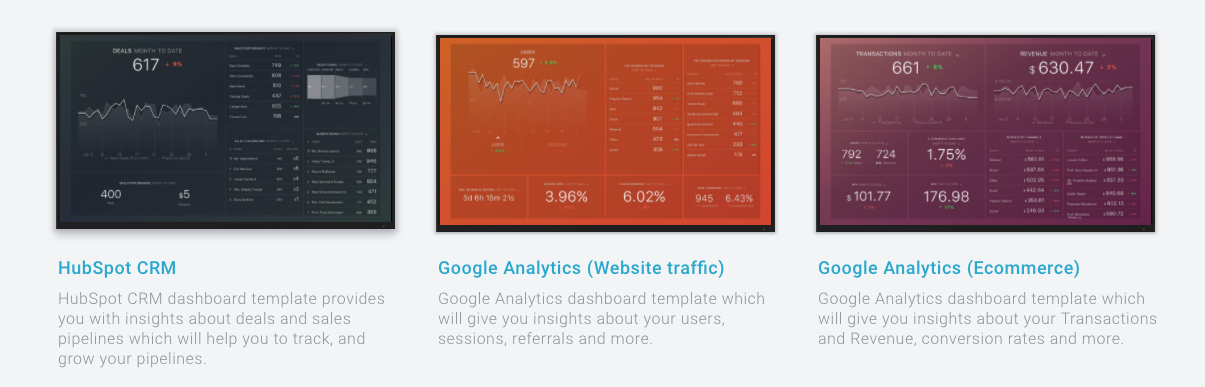
It's extremely helpful to be able to pull data from multiple sources into one system. For example, we might use Hubspot, Google Analytics, and Facebook data. Being able to report on data from all of those in one place saves time and navigating around different sources. In addition, the templates make it easy to start using right away.
I haven't been using Databox long, but I had an issue with accounts staying connected - while they were initially connected, something happened when I was done setting up databoards.
This saves time and resources by being able to set up a link to the report, as it's continuously pulling data.
The design of the dashboard looks goed and it works awesome!
It would be even more awesome if i can get rid of the gradient in the background.
More motivation and insights in our goals. Both where realised.
The idea of a canvas. It is fast and easy to create a dashboard. And with a couple of clicks you can share it.
I would need a functionality to export easily these charts to powerpoint.
The tools saves a lot of time preparing reports to each customer.
Databox is very simple to set up and use. Furthermore, the connectors into databox were reliable.
Databox lacks the customisation and control that you get with other data visualtion platforms.
Databox solved the problem of manually reporting. Instead of manually getting data from the engine and putting it into a spreadsheet, you can put it into databox instead.
It visualizes some of the most important data from your platforms all in one place. Tons of metric options.
It definitely will not replace an analyst on your team. I still take a decent amount of time sorting through my dashboards to pull out actionable insights. Also, cross-platform display is not as great as it could be.
It makes reporting faster and more aesthetically pleasing. It's great for reporting on Facebook Ads specifically for us because it gives us quick overviews on which campaigns are performing best relative to as spend.
I think Databox is a very well organized and easy to navigate platform. I enjoyed that it didn’t take me long to figure out how to work through their platform to accomplish what I wanted.
If anything, I’d say just the expenses with Databox.
Viewing a lot of KPI’s in once platform, generating reports. Beneficial to both large and small businesses.
Using databox we can use our own existing data pull it all at one place and then we can see the real time insights and can track the performance. It also supports third party integration like google analytics, hubspot etc. Free plan is good.
Everything is good so far all i can think of about is like it can be a bit easier while it comes to make our own data connectors. Rest all are fine.
We are solving major problems like identifying and tracking the performance using real time insights. Using third party integration with google analytics to dive even more deeper into data and see other aspects as well.
A decent way to store information in databases and gain insight into that data.
Sometimes pulling information from the cloud seems to take a long time.
Storing and manipulating large amounts of data.
I liked having an updated data snapshot of campaign performance across all channels. This stopped the need to visit each marketing platform to overview. And allowed me to identify quickly any channel that required closer inspection.
The only thing that I didn't like was that a user can be sometimes limited to the amount of information that can be shown in a single dashboard. I personally would prefer to have all the information to appear within a single view, even if I have to scroll down a little. However I realise that these dashboards are most likely to be shown on large TV screens within agencies or businesses.
Having all the information compiled into a single dashboard allows for easy reporting and negates the need to manually capture the details of each data segment to create the visualisation. Now the time can be spent analyising the results and providing clear direction to a client on the next steps in their marketing campaign
Simplicity is the name of the game here. This BI dashboard tool is best for non-developers who want an inexpensive tool for metrics refreshed daily. It connects well to Hubspot and a few other APIs with little effort. The out-of-the-box selection of metrics is pretty large. The block-space based UI is also pretty well designed and fun to look at. Plans are reasonably priced compared to other more expensive options like Grow and Domo. API is fairly reliable here with fewer data connection/refresh issues than Grow which would sometimes be flat out wrong at times with little reason or warning.
There isn't a lot of granular control here. Metrics pretty much come as they are and unless you have one of the highest plans, even filters are out of the question. Filters are included with the Query Builder level but this Query Builder title is a little misleading as you still don't have access to the data as a full table and there are no actual ways to Query with SQL. Because of this, date filters are very static and clunky too. You can only choose what options they give you (IE last week, this week, this year, year to date etc.) but more advanced ones like 'next year' or 'this year and next' which would be easy in SQL can't be made. Because of some of these rails, we are running into problems where deals aren't showing up in the pipeline totals because we are nearing the end of the year and our close date filter has to be set on this year because it requires a date range and "all-time" or "This year and next" isn't an option. API selection is getting there but it still lacks the variety of connections that Grow did. Our company uses Harvest as our time tracker and invoice platform but the Harvest API is very new and lacking invoice metrics. I'm sure these may come out soon but for now it is unusable for revenue metric purposes. No connection to Google sheets or CSV uploads so there really isn't any flexibility on data there either.
Automated reporting. Sales activity and performance metrics. SEO, SEM activity and performance metrics. Both of these work exactly as they should.